
Data logging and analytics help you make smarter farming decisions by providing accurate, real-time information on soil moisture, temperature, and crop health. Regular sensor calibration guarantees your data stays reliable, while visual tools like charts and maps make complex data easy to understand. By integrating these practices, you can optimize resource use, increase yields, and adapt effectively to climate changes. Keep exploring to discover how these strategies can transform your farm management skills.
Key Takeaways
- Data logging captures real-time field conditions to inform precise irrigation, fertilization, and resource management decisions.
- Analytics identify patterns and anomalies, enabling early problem detection and proactive interventions.
- Regular sensor calibration ensures accurate data collection, supporting reliable analysis and decision-making.
- Visualizing data through charts and maps simplifies complex information, highlighting key areas for targeted action.
- Integrating calibrated data and visualization enhances crop yields, reduces costs, and promotes sustainable farm management.
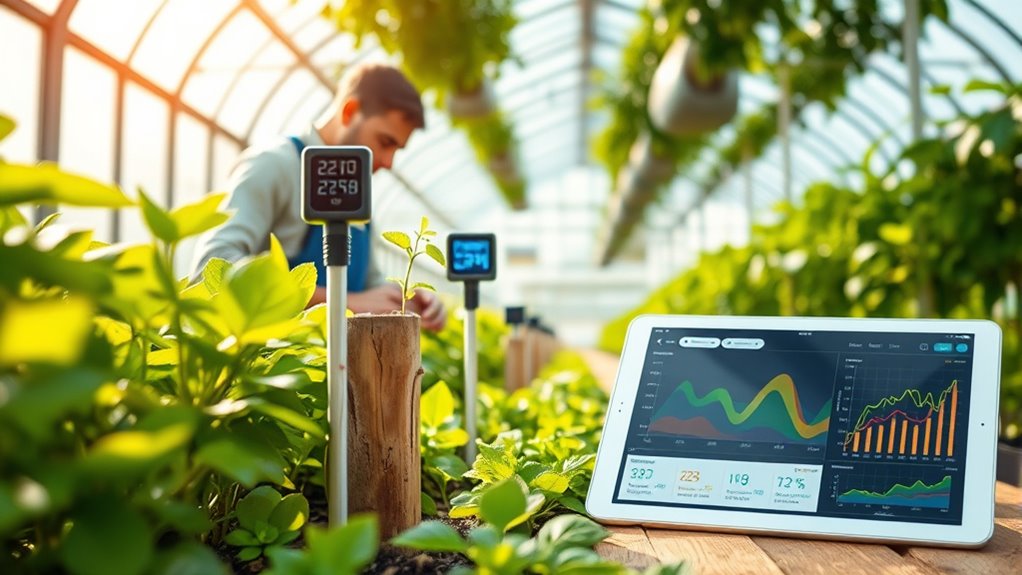
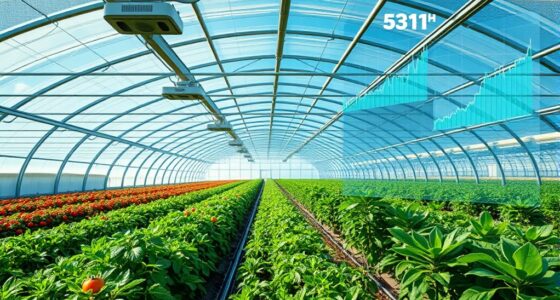
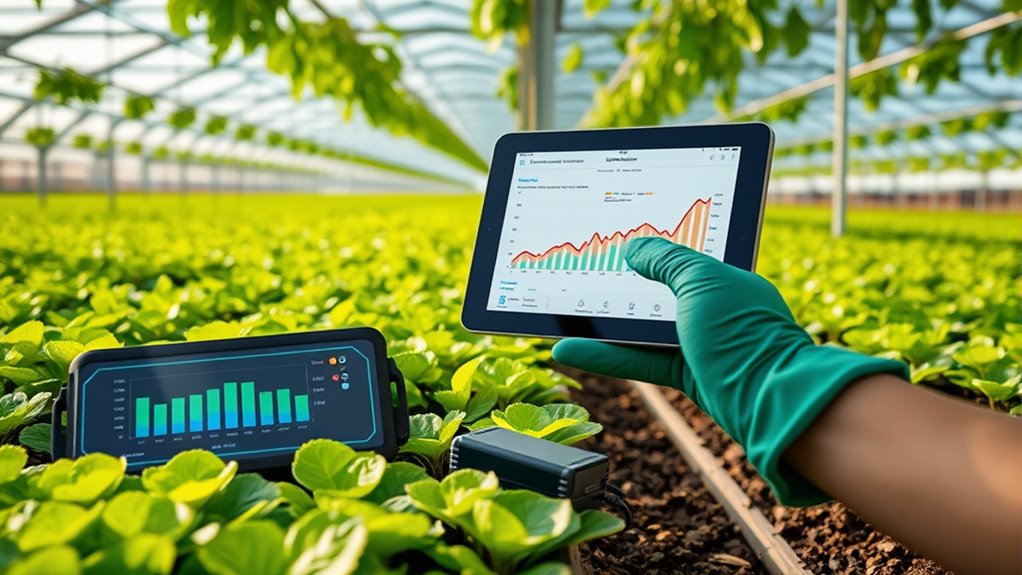
In today’s competitive agricultural landscape, data logging and analytics have become essential tools for growers seeking to optimize yields and improve efficiency. By collecting accurate information from your fields, you gain insights that help you make informed decisions. One key aspect of effective data collection is sensor calibration. Without proper calibration, sensors can provide misleading readings, which could lead to incorrect actions — like overwatering or under-fertilizing. Regular sensor calibration ensures your data remains accurate, allowing you to rely on the information provided. When sensors are correctly calibrated, you can trust the data they deliver on soil moisture, temperature, humidity, and other critical parameters. This accuracy becomes the foundation for successful analytics, enabling you to pinpoint issues early and adjust your practices accordingly. Additionally, understanding climate change impacts on tea cultivation can help you adapt your strategies for more resilient crop production. Once your sensors are calibrated, the next step involves making sense of the data through visualization tools. Data visualization transforms raw numbers into easily understandable graphs, charts, and maps, giving you a clear picture of your field’s conditions. Instead of sifting through spreadsheets, you can quickly interpret trends and anomalies, saving time and reducing guesswork. For example, a heat map showing soil moisture levels across different zones in your field can reveal areas that need irrigation adjustments. Visual data allows you to identify patterns — like a section of the field consistently underperforming — so you can target interventions precisely where they’re needed. This targeted approach minimizes resource waste and maximizes crop health. Using data visualization also enhances your ability to monitor changes over time. When you log data regularly, visual tools help you track how your crops respond to different inputs or weather conditions. You can see the impact of fertilization schedules or irrigation strategies and refine them based on visual insights. Additionally, these tools empower you to communicate complex data clearly to team members, consultants, or investors, fostering collaborative decision-making. By integrating sensor calibration and data visualization into your data logging efforts, you turn raw information into actionable intelligence. This process guarantees your practices are based on reliable data, ultimately boosting crop yields and reducing operational costs. In essence, focusing on proper sensor calibration and leveraging data visualization transforms your farm management. You’ll make smarter choices faster, respond proactively to field conditions, and optimize your resources. As technology continues to evolve, mastering these elements will be imperative to staying competitive and achieving sustainable growth in agriculture.
Frequently Asked Questions
How Secure Is My Data Stored in Logging Systems?
Your data is generally secure in logging systems because they use data encryption to protect your information from unauthorized access. Access controls limit who can view or modify your data, adding extra security layers. However, it is crucial to choose systems with strong encryption protocols and strict access controls. Regularly updating passwords and monitoring who accesses your data also help guarantee your information stays safe and private.
Can Data Analytics Predict Future Crop Yields Accurately?
Yes, data analytics can predict future crop yields with a good degree of accuracy, especially through crop yield forecasting and predictive analytics accuracy. By analyzing historical data, weather patterns, and soil conditions, you can make informed decisions about your farming practices. While predictions aren’t always perfect, the insights gained help you optimize resources and improve outcomes, making predictive analytics a valuable tool in modern agriculture.
What Is the Average Cost of Implementing Data Logging Systems?
You might find that implementing data logging systems costs around $2,000 to $10,000, depending on your needs. Key cost factors include equipment expenses like sensors, meters, and servers, as well as installation and maintenance. While initial investments can seem significant, the benefits of better crop management often outweigh the costs. Planning carefully helps you balance expenses, ensuring you get the most value from your data-driven approach.
How Do I Choose the Right Analytics Tools for My Farm Size?
To select the right analytics tools for your farm size, consider farm size considerations like acreage and crop diversity. Look for tools with features that match your needs, such as real-time monitoring or predictive analytics. Smaller farms may benefit from simple, user-friendly platforms, while larger operations might need advanced systems with integrations. Evaluate each tool’s scalability, ease of use, and cost to make sure it aligns with your farm’s current and future needs.
Are There Any Privacy Concerns With Cloud-Based Data Logging?
Yes, there are privacy concerns with cloud-based data logging. You should be aware of farmer privacy and data ownership issues, ensuring that your data remains yours and isn’t shared without consent. Always review the cloud provider’s privacy policies and data security measures. By doing so, you protect your sensitive farm information and maintain control over how your data is used and stored.
Conclusion
Think of your farm as a mighty ship sailing through unpredictable waters. Data logging and analytics are your trusted compass, guiding you through storms and calm alike. With these tools, you can navigate with confidence, adjusting your course based on real insights. Embrace this technology as your steadfast navigator, steering your farm toward a future of growth and success. Remember, a well-informed captain always reaches their destination—so harness your data and sail with purpose.