
To monitor air quality in your neighborhood, you need reliable sensors that track pollutants like particulate matter, nitrogen dioxide, and ozone. Proper calibration guarantees these sensors provide accurate, trustworthy data over time. This data can be visualized through maps, graphs, and dashboards that highlight pollution hotspots and changes. Combining precise calibration with clear visual tools helps you understand pollution patterns and make informed health decisions. Keep exploring to discover how these tools can improve your local environment.
Key Takeaways
- Deploying calibrated sensors provides accurate, real-time air quality data for neighborhood monitoring.
- Visualizing sensor data through maps and graphs helps identify pollution hotspots and trends.
- Regular sensor calibration prevents data drift, ensuring reliable information for health and policy decisions.
- Integrated monitoring systems enable quick responses to pollution spikes and inform community actions.
- Clear, accessible data fosters community engagement and supports public health initiatives.

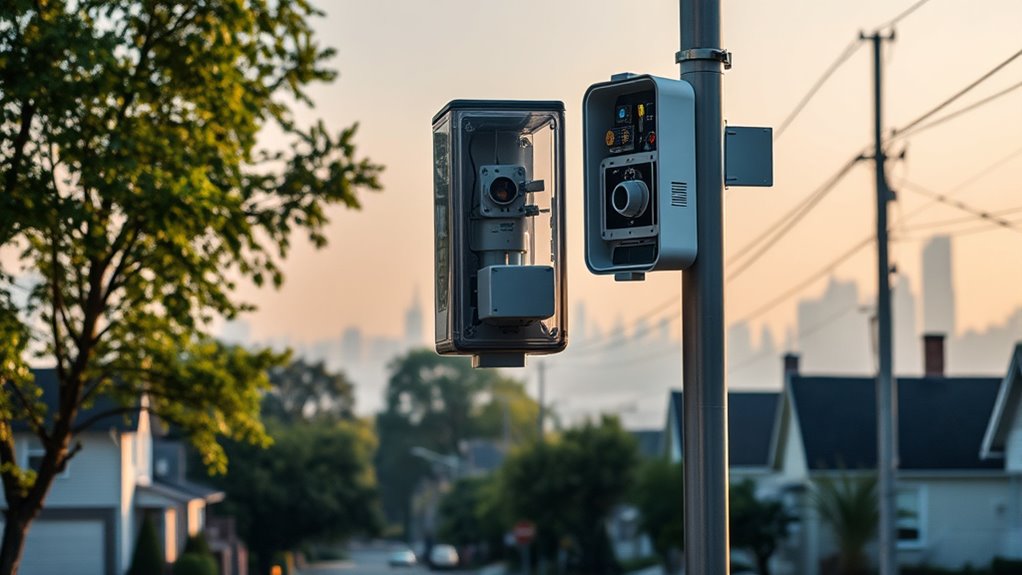
Have you ever wondered how we keep track of the air we breathe? It’s a complex process that relies on a network of sensors strategically placed throughout neighborhoods. These sensors constantly monitor levels of pollutants like particulate matter, nitrogen dioxide, and ozone. But for the data they collect to be useful, it’s vital that these sensors are properly calibrated. Sensor calibration involves adjusting the sensor’s readings to match standardized measurements, ensuring accuracy over time. Without regular calibration, sensors can drift, providing unreliable data that might mislead community officials or residents about air quality conditions. By maintaining well-calibrated sensors, we get trustworthy data, which forms the foundation for effective air quality management.
Proper sensor calibration ensures accurate air quality data for effective community health decisions.
Once the sensors gather data, the next step is to make sense of it all. That’s where data visualization comes into play. Instead of sifting through endless numbers, data visualization transforms raw data into easy-to-understand charts, maps, and graphs. Imagine a real-time air quality map of your neighborhood that highlights areas with elevated pollution levels. This visual approach allows residents, city planners, and health officials to quickly identify pollution hotspots and track changes over time. With interactive dashboards, you can even explore how air quality fluctuates during different times of the day or in response to weather conditions. Data visualization helps communicate complex information clearly, empowering you to make informed decisions about health precautions or community initiatives. Additionally, sensor calibration ensures the accuracy of the measurements that feed into these visual tools, making the insights more reliable.
Integrating sensor calibration with data visualization creates a powerful system for neighborhood air quality monitoring. Accurate sensors provide reliable data, which, when visualized effectively, offers immediate insights into pollution patterns. This combination helps identify sources of pollution, assess the effectiveness of policies, and alert residents to hazardous air conditions. For example, if a spike in particulate matter is detected near a construction site, visual tools can pinpoint the exact location and time, prompting quicker responses. Over time, this continuous feedback loop improves local air quality management strategies. As a resident, you benefit from transparent, real-time information that keeps you aware of your environment, helping you decide when to stay indoors or take other precautions.
In essence, maintaining precise sensor calibration and leveraging data visualization are key to understanding and improving neighborhood air quality. They make complex data accessible and actionable, giving you the tools to stay informed about what’s in the air you breathe. This technological synergy not only enhances public health efforts but also fosters community engagement by making air quality data visible and understandable for everyone. Whether you’re concerned about pollution on busy streets or near industrial zones, these innovations ensure you’re better equipped to protect your health and advocate for cleaner air.

Air Quality Monitor Indoor, 10 in 1 Portable Smart Air Quality Tester for CO2 | TVOC | HCHO | Temp | AQI | PM0.3-1 Detection Suitable for Home, Cars, Plants, Pets and Hotels
- 10-in-1 Multi-Gas Detection: Monitors CO2, HCHO, TVOC, benzene, PM2.5/10
- HD Color Display Screen: Real-time data with visual alerts
- Intelligent Data Reporting: Automatic environmental quality assessments
As an affiliate, we earn on qualifying purchases.
As an affiliate, we earn on qualifying purchases.
Frequently Asked Questions
How Do Air Quality Sensors Work in Urban Environments?
You place air quality sensors strategically in urban environments, ensuring they’re near pollution sources and well-ventilated. These sensors detect pollutants like particulate matter, gases, and VOCs using built-in detection technologies. They then transmit the data wirelessly through Wi-Fi or cellular networks, allowing real-time monitoring. Proper sensor placement and reliable data transmission are essential for accurate readings, helping you assess air quality and take action to improve neighborhood health.
What Factors Influence Real-Time Air Quality Data Accuracy?
Did you know that improper sensor placement can cause data inaccuracies by up to 30%? Your real-time air quality data’s accuracy depends heavily on sensor placement, which guarantees it captures representative air samples. Additionally, reliable data transmission is vital; any disruption can lead to gaps or errors. Factors like nearby pollution sources, weather conditions, and even sensor calibration also influence data accuracy, so careful setup and maintenance are indispensable for trustworthy readings.
How Can Residents Access Local Air Quality Reports?
You can access local air quality reports through community engagement initiatives like neighborhood meetings, online portals, or local government websites. Many areas provide free, real-time data to residents. Just be mindful of data privacy; make sure the sources are reputable and protect your personal information. By staying involved and informed, you’ll better understand your air quality and contribute to community health efforts.
Are There Health Risks From Long-Term Exposure to Monitored Pollutants?
Long-term exposure to monitored pollutants is like walking through a fog that gradually thickens; it can pose serious health risks. You might experience lasting effects on your lungs, heart, or overall well-being. Pollutant effects accumulate over time, increasing the chances of chronic respiratory issues or cardiovascular problems. Staying informed about air quality reports helps you reduce exposure and protect your long-term health. Don’t ignore these risks—your well-being depends on it.
How Often Are Air Quality Monitoring Devices Calibrated?
You should calibrate air quality monitoring devices regularly, typically every few months, to guarantee accurate readings. Sensor maintenance is vital, as it helps keep the sensors clean and functioning properly. Calibration frequency varies depending on the device and environmental conditions but generally occurs every 3 to 6 months. Staying consistent with calibration and sensor maintenance guarantees reliable data, helping you better understand and manage local air quality.
Conclusion
You now see how neighborhood air quality monitoring keeps us safer and healthier. Did you know that nearly 90% of people worldwide breathe polluted air? By using these monitoring systems, you can stay informed and take action to reduce exposure. Remember, small steps like planting trees or avoiding busy roads can make a big difference. Staying engaged and aware helps protect your community’s health—because clean air is a right, not a privilege.